Extracted Edges
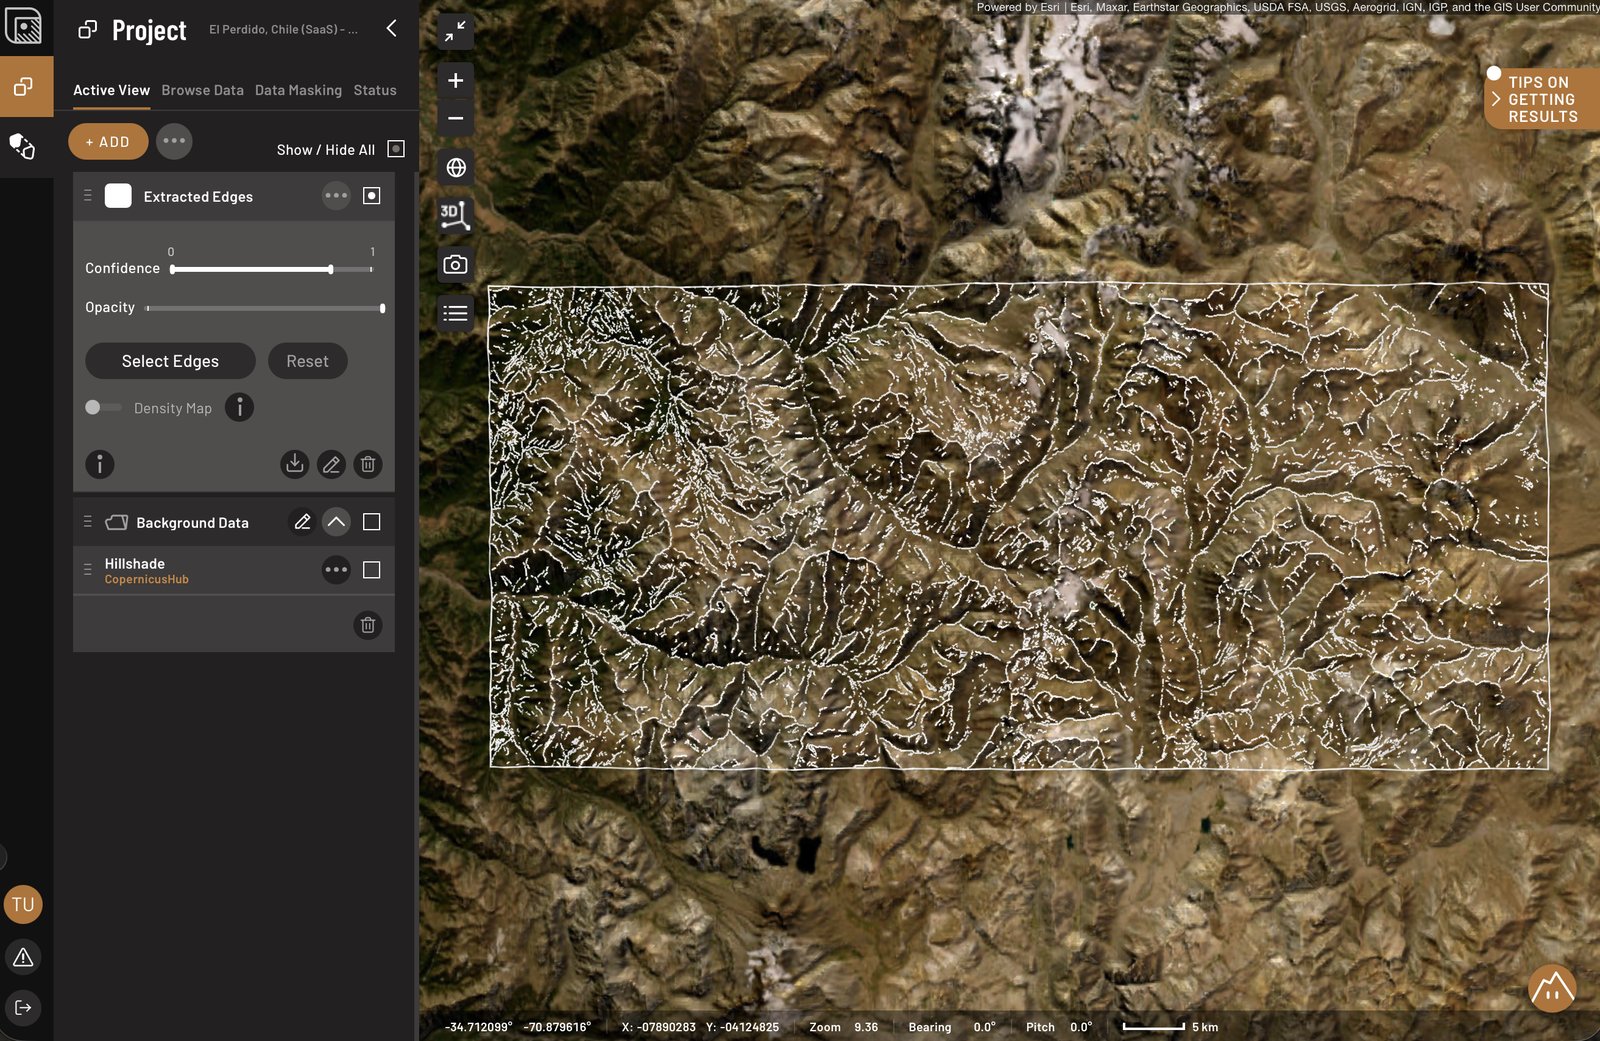
Extracted Edges detects linear features in shaded relief derived from the input DEM. The output is a set of candidate topographic lineaments. Some may correspond to geological structures such as faults, fractures, fold axes or lithological contacts, but the extraction itself does not determine their geological origin.
Confidence is a range with a high and a low bound, and it controls detection sensitivity. Raising it returns fewer and sharper lines.
Adding and tuning the layer
- Open the Browse Data tab, open Structural → Extracted Edges, and click Add layer.
- Adjust Confidence:
- raise the high value to detect fewer structures
- lower the high value to reveal more detail
- raise the low value to break lines apart
- lower the low value to make lines more continuous
- narrow the gap between high and low for more binary behavior
- widen the gap for more stable contours
- Filter by edge type if you only want some of the results, and change the selection whenever you like.
Start tight. A permissive setting produces a dense mesh of lines that is hard to read and hard to argue with, and it is easier to loosen a threshold than to unsee a pattern.
What the source DEM does to the result
GLO-30 is a surface model, not bare earth. In forest and built-up ground it describes the top of the canopy and the roofs, so a clearing edge, a plantation boundary or a treeline reads as relief. It also carries flattened water bodies, void-fill patches and residual stripe artifacts from its radar source, and the edge extractor will trace all of them.
At 30 m posting you need two to three samples across a feature for a reliable linear break, so anything narrower than roughly 60 to 90 m will not appear dependably.
Where it misleads
The method detects brightness gradients on a hillshade. It has no concept of geology, so it cannot distinguish a fault trace from a road, a field boundary, a powerline cut, a DEM artifact, or noise in the elevation model.
The extraction also applies an OpenStreetMap mask before turning detected edges into lineaments. It downloads mapped buildings, roads and waterways within the DEM extent and masks those areas out of the edge-detection result, buffering roads and buildings by 50 m and waterways by 350 m. That removes the obvious anthropogenic and water-related responses, but not every non-geological lineament — particularly anything OpenStreetMap does not have.
So check every candidate lineament you intend to interpret against the base map imagery. Man-made lines are obvious there and unmistakable once you look.
Then test the line against the light, and read the test the right way round. Hillshade brightens features running across the illumination and hides features running along it. A real topographic lineament therefore must come and go as you rotate the azimuth: it disappears when the light runs along its strike, and that disappearance is expected rather than evidence against it. What discredits a line is the opposite behavior, showing up at every azimuth including along-strike, which usually means a DEM tile seam or a stripe artifact rather than terrain.
The decisive check is not the shading at all. Take an elevation profile across the line and see whether the DEM actually steps there. Slope, aspect and curvature, or a multi-directional hillshade, are azimuth-independent and settle the question faster than rotating a single light.
One property to know before you count anything
If the extraction runs on a single fixed illumination, the delivered set has a built-in orientation blind spot: structures striking at or near that azimuth are systematically under-detected. Treat the layer as one directional sample of the structural fabric rather than a complete one, and do not build lineament density statistics or a strike rose diagram from it without re-running at other azimuths or checking against an azimuth-independent product.