The app, section by section
The left edge of a workspace is an icon rail with three destinations. Everything else is a panel that opens beside it, or a tool on the map. This page is a map of that layout. For the order to work through, see How to work in TerraEye.
The icon rail
Portfolio Map takes you back to the world map of every area you have access to.
Project opens the data panel, which is where you will spend most of your time. Four tabs, described below.
Analogy Lab opens the interpretation workspace. Two tabs: Find Similar and Inspect. See Analogy Lab.
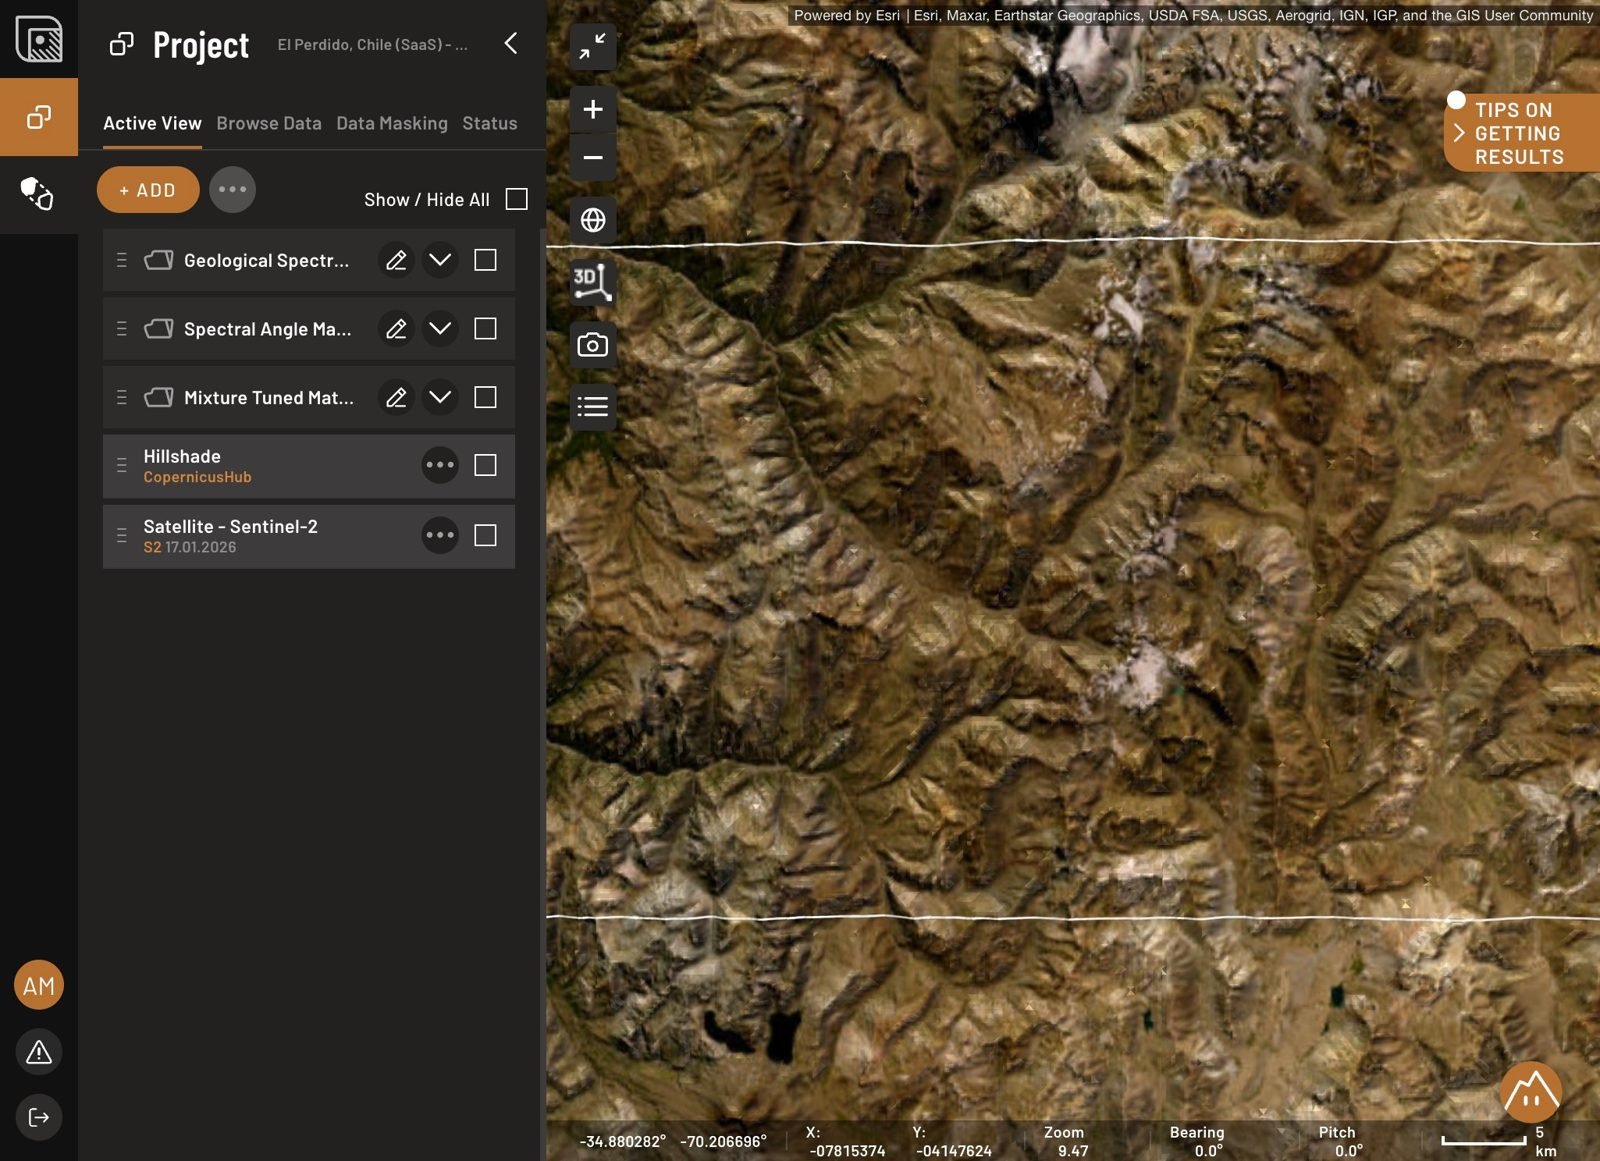
Project → Active View
The layers currently on the map, with their thresholds and styling. Show / Hide All toggles everything at once, and + ADD opens the same menu as in Browse Data:
- draw a custom shape,
- order AI Spectral Targets,
- add preset layers for a specific deposit type,
- request additional satellite data and analysis,
- upload your own data.
Adjust color, opacity and value range here, and export a layer for use elsewhere. Phase 5 covers which way each slider runs.
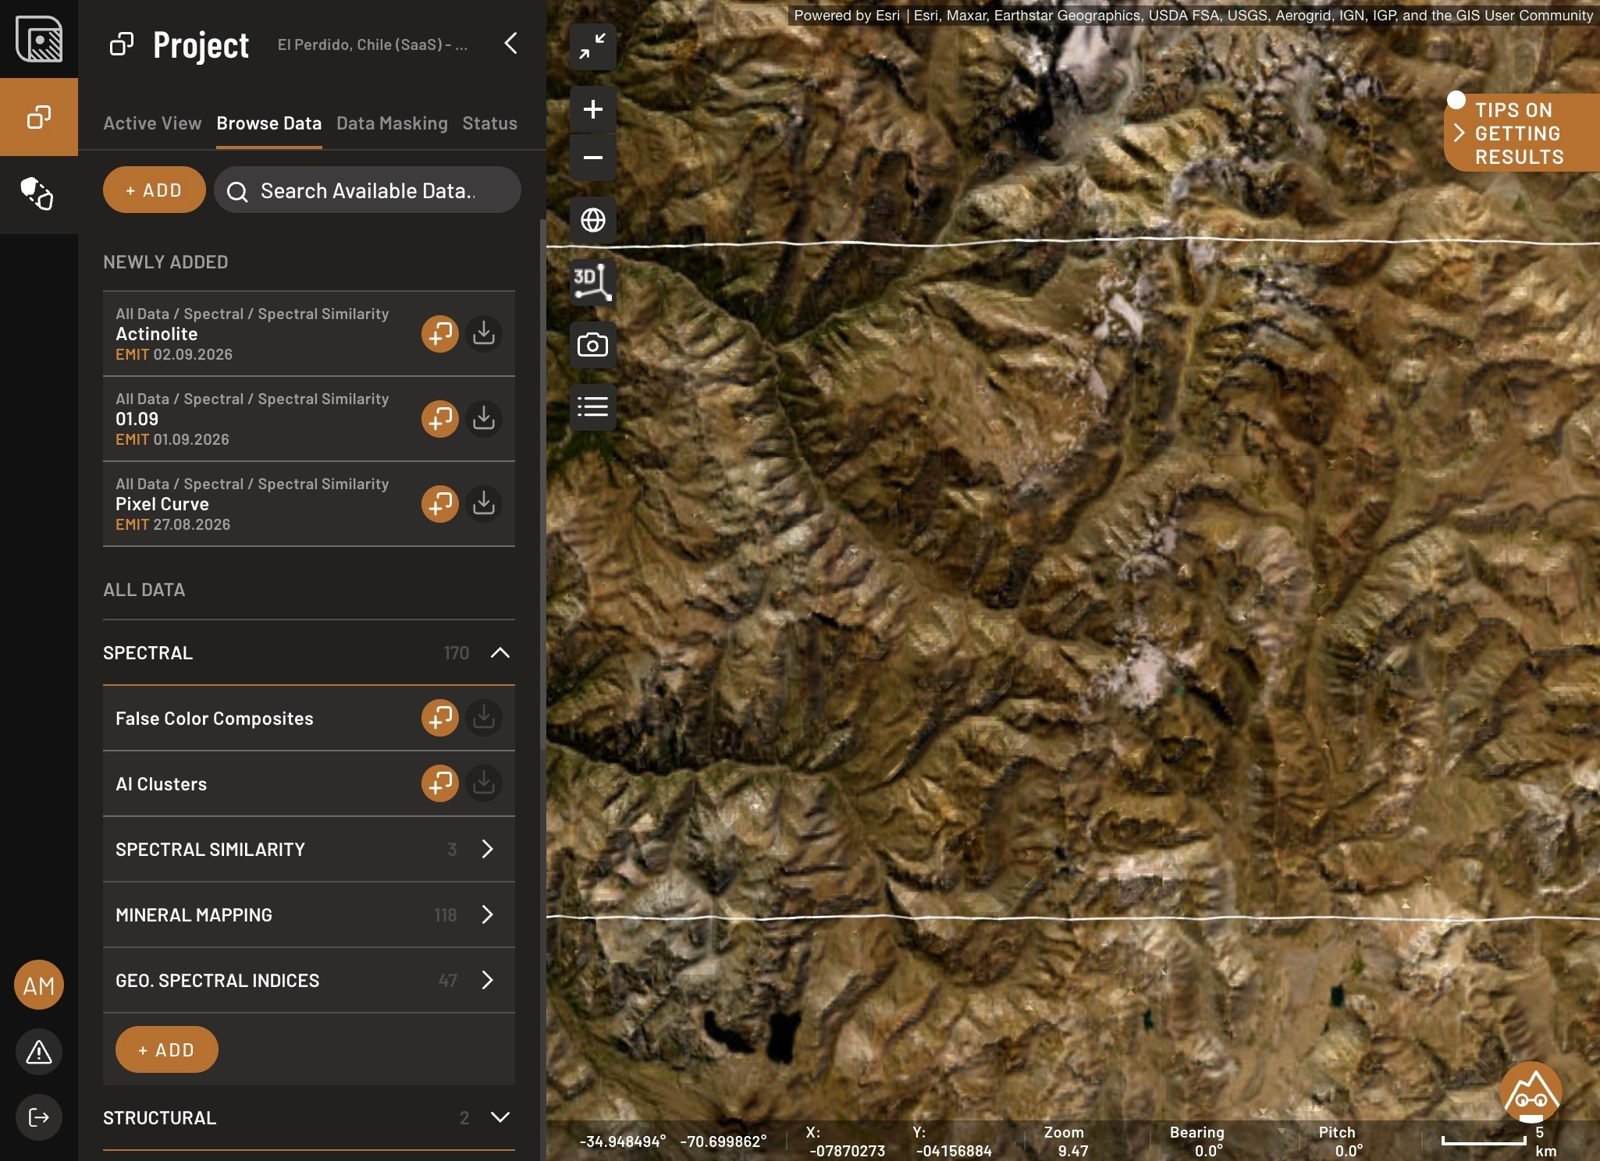
Project → Browse Data
Everything available for the area, grouped by geological domain rather than by file type: Spectral, Targets, Structural, Geophysics, Geochemistry, Environmental proxies, and base and context layers. Within Spectral you will find False Color Composites, AI Clusters, Spectral Similarity, Mineral Mapping and Geological Spectral Indices.
Tick a result to bring it into Active View, or use the download icon to export it. Newly added at the top collects whatever arrived most recently, and the search box filters the whole tree.
For what each of these actually computes, see the Knowledge base.
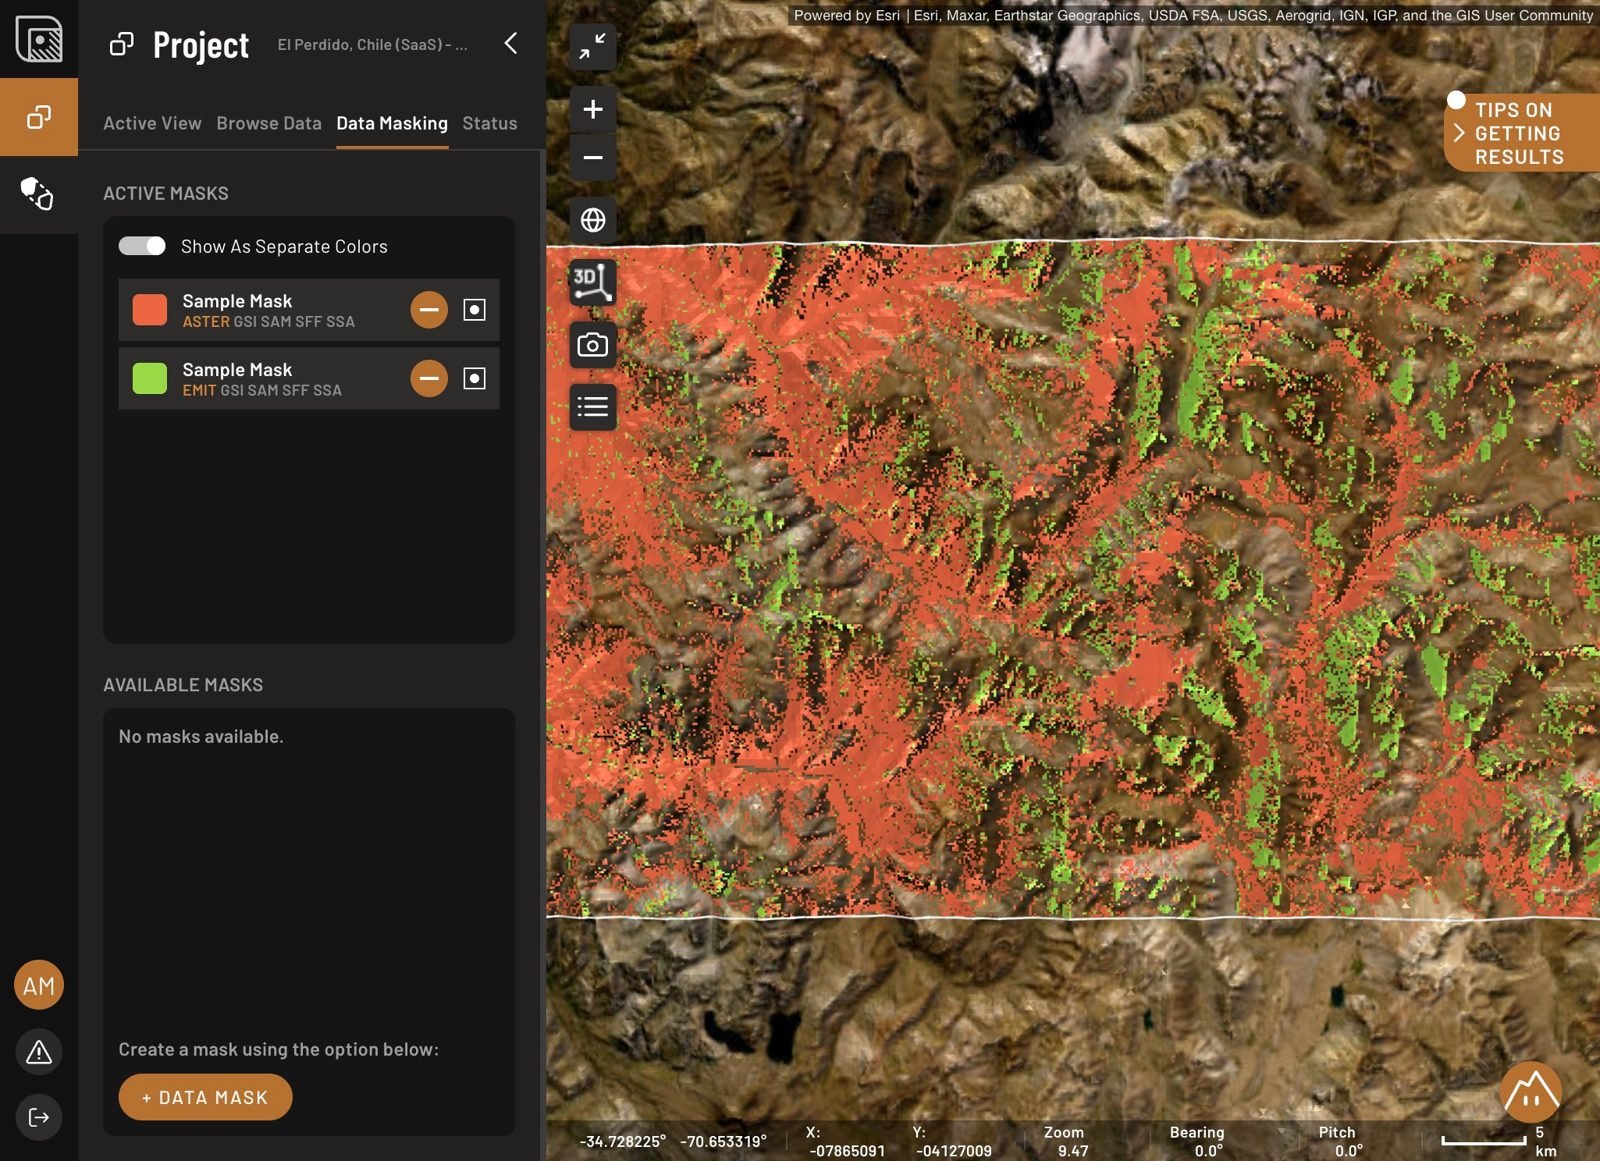
Project → Data Masking
Active masks are the ones currently applied. Available masks are the ones you have built and can switch on. + DATA MASK creates a new one.
Build a separate mask for each provider, and set it before you interpret anything. See Data Masking and Phase 2.
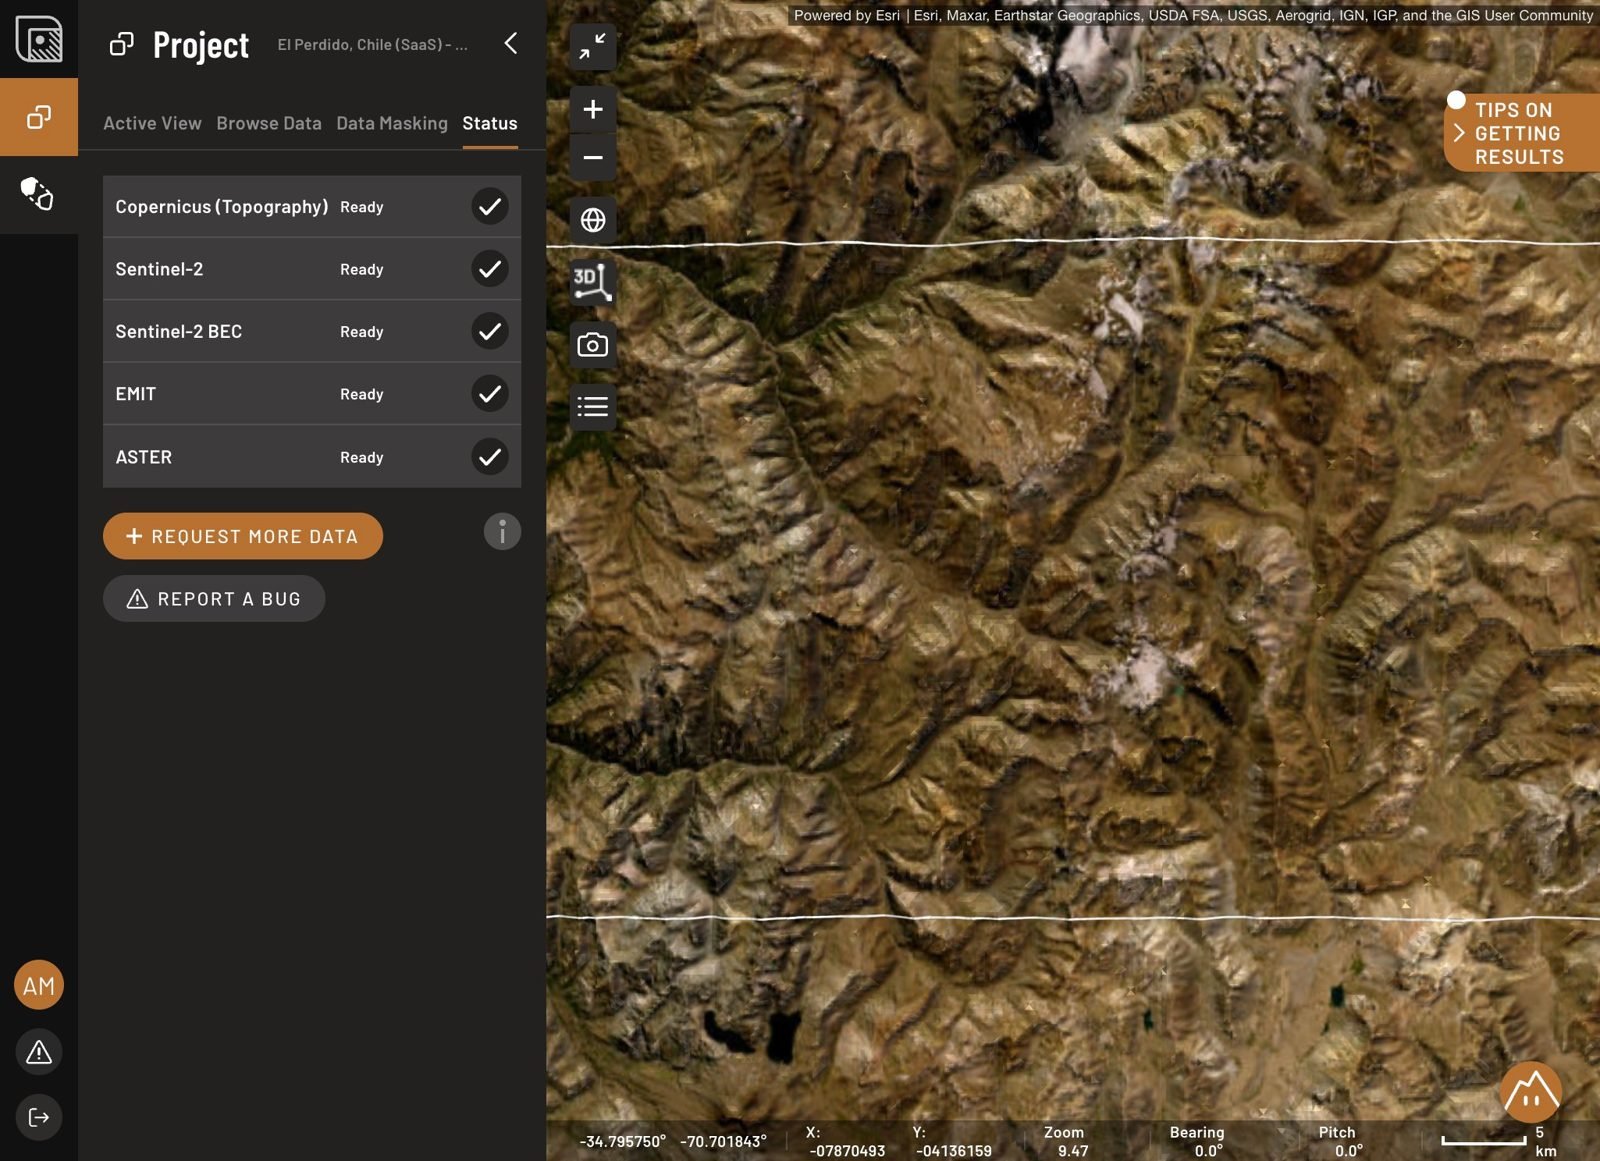
Project → Status
The processing state of everything you have ordered for this area, so you can tell the difference between a result that is empty and a result that has not arrived. Request more data and Report a bug both live here.
Map tools
Down the left edge of the map:
| Tool | What it does |
|---|---|
| Fit map to area | Zooms back to the area boundary. |
| Zoom in / out | The usual. |
| Map settings | Coordinate grid, area extent, and base map. |
| 2D / 3D | Switches to a tilted view, which is the quickest way to judge whether a lineament follows real relief. |
| Take screenshot | Captures the current map view as an image. |
| Legend | Shows the active layers and a scale bar. |
Everything else on screen
Tips on getting results, top right, opens the built-in step-by-step workflow panel. It is the same pass this documentation describes.

Ignacy, bottom right, is the AI assistant.
Your account, bottom left, holds account settings, support, and logout.
Also in this section: Portfolio Map, Ignacy, Account management, FAQs and troubleshooting.