Phase 8 · Bring in geophysics and geochemistry
A confirmed curve tells you the surface mineralogy is right. It does not tell you what sits underneath or whether anything other than reflected light points at the same place. This is the only phase where the evidence comes from something other than the satellite spectral data.
Magnetics — check the scale first
Magnetics arrive with your area, but the resolution depends on where you are. The global base grid is EMAG2 v3 at roughly 3.5 to 4 km per cell, and one cell swallows your whole candidate, so read it the way you read gravity: regional architecture, whether your ground sits on a high or a low. National surveys (US, Canada, Australia) are used automatically where they exist, and so is your own airborne or drone survey if you send the TMI raster to our team. Those are target-scale, so check the cell size against your candidate. In TerraEye you can manipulate view of magnetic data to look for patterns and lineaments. Automated magnetic lineament extraction tool is not yet available.
Two layers, if this isn't your background
Load RTP to see where the magnetic bodies sit, and the Tilt Derivative to sharpen the gradients between them and bring out possible source boundaries and lineaments.
A magnetic edge may correspond to a fault, an intrusive margin, a lithological contact or an alteration front, but the magnetics can't tell you which: the transformation shows where a magnetic property changes, not why. So, check what you find against your geological map, and ask Ignacy if you need some knowledge.
Then switch Raster to Shaded and rotate the sun azimuth, because a magnetic grid is a surface and lineaments in different orientations light up in turn.
A lineament that survives several transformations is better evidence than one that shows up in a single filter. The Tilt Derivative is computed from RTP, so those two agreeing is one calculation seen twice, while agreement with Analytic Signal counts for more, because that one is computed from TMI.
One caution, because it doesn't announce itself on the map. At low magnetic inclination RTP becomes unstable and can introduce artifacts that read as lineaments, so below roughly 15 to 20 degrees use it carefully and lean on Analytic Signal, which depends much less on magnetization direction. Strong remanence affects RTP the same way, and noisy data can produce artifacts at higher inclinations too. The docs cover the other products and where each one misleads.
Geochemistry — your samples, on the map
An assay measures rock rather than an interpretation of light, which makes it the strongest support here, as long, as your samples are residual soil or rock. Over transported cover a surface sample describes the till, not the bedrock under it, so record the sample medium either way.
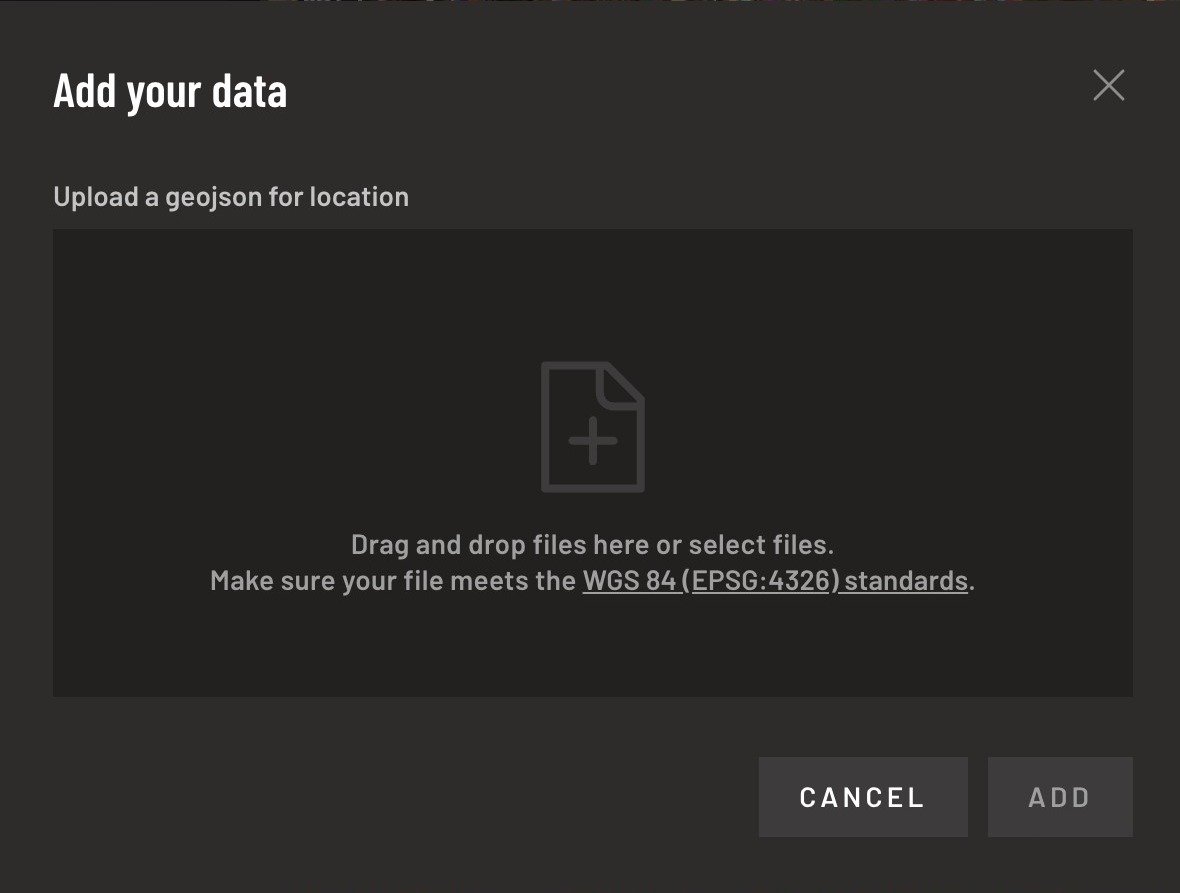
Adding it. Send us two CSVs: the assay data, one row per sample with an ID, longitude, latitude and one column per element; and a metadata file naming each element's Column Name, Method, Units and Detection Limit. A GeoJSON in EPSG:4326 you can upload yourself under +Add → Upload Data; shapefiles, KMZ and other coordinate systems come to us to convert.
What comes back. Sample points carrying every element value. No interpolation methods available yet.
Working with it. A point layer can be opened by clicking on Edit Shapes & Classify — open the Attribute Table inside to read values, Re-classify to group samples by one element, Pick Gradient to color that grouping so hot spots show. Changes stay local until you Save. Attribute table can be easily edited.
What counts as support, and what doesn't
Magnetics on a fine enough grid, geochemistry that resolves your candidate, and your own maps, drilling and workings are independent of your spectral result. The global magnetic grid and the gravity model are context, not support.
Done when
You know, for each candidate, whether anything non-spectral agrees with it. A candidate with no independent support is still a target if its curve is confirmed. It's just a weaker one, and saying so is what makes the strong ones credible.