Your own data
An assay measures rock. A spectral layer measures an interpretation of reflected light. That difference is why your own data is the strongest evidence you can put beside a spectral result, and why it is worth the effort of getting it into the platform.
What you can upload yourself
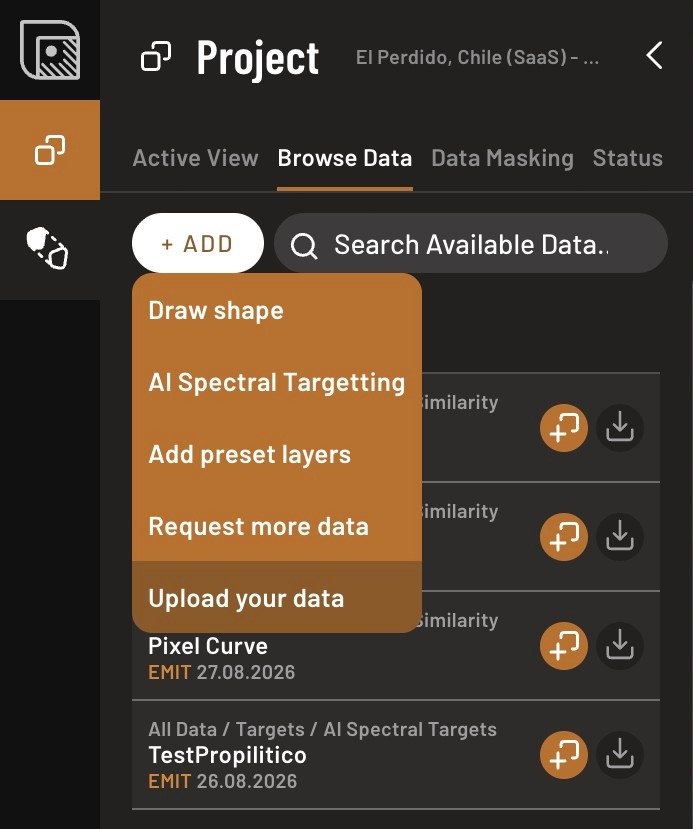
GeoJSON in WGS 84 (EPSG:4326), through + ADD → Upload your data. Points, lines and polygons all work, and every attribute in the file comes with it.
Shapefiles, KMZ, and anything in another coordinate system: send them to us and we will convert and ingest them.
Geochemistry
Send two CSV files:
- The assay data. One row per sample, with a sample ID, longitude, latitude, and one column per element.
- A metadata file, one row per element: Column Name (the element's column header in the data file), Method (the analytical method the value was obtained with), Units (ppm, ppb, %, g/t and so on), and Detection Limit for that method.
The metadata file is not paperwork. Without units and a detection limit, a value cannot be compared against anything, and a non-detect cannot be told apart from a zero.
Send these with it
None of the following is a file format requirement. All of it is what the difference between an anomaly you can defend and a colored dot amounts to, and a geochemical anomaly is usually the first thing you will be asked to defend.
Specify the digestion, not just the method. Aqua regia, four-acid and fusion on the same sample can differ by an order of magnitude for the same element, and a partial-leach value is not comparable with a total digest. Say also whether a value is reported as the element or as the oxide, since Fe against Fe₂O₃ and K against K₂O are different numbers.
State the coordinate reference system and datum. Historical exploration data routinely arrives on a local mine grid or a pre-WGS 84 datum, and an unflagged datum shift is a few hundred meters of misplacement — enough to move a sample off the anomaly it is supposed to define.
Describe the sample. Medium, horizon, depth, and size fraction each move values by factors: −80 mesh and −180 mesh are not the same population, and rock chip, channel, float, core and stream sediment are not intercomparable at all. Add who collected it, when, and whether it is historical data of unverified quality.
Send your QA/QC. Laboratory name, analytical batch or job number, blanks, certified reference materials, field and pulp duplicates, and any re-assays.
Flag censored and over-range values explicitly, so a <DL or an over-limit result is not read as a zero and does not enter a color ramp as one.
What comes back
Sample points carrying every element value. No interpolation methods are available yet, so you get the points as measured rather than a gridded surface.
Working with the points
Click Edit Shapes & Classify on the layer to open the Attribute Table and read values. Re-classify groups samples by a single element, and Pick Gradient colors that grouping so the high values stand out. Changes stay local until you click Save.
Do not edit assay values. The attribute table is editable, and that is for notes and interpretation. An edited assay no longer reconciles to the laboratory certificate, and the dataset stops being auditable. If a value is wrong, re-ingest a corrected file from the lab.
Classify with the distribution in mind. Geochemistry is log-normal and compositional, so equal-interval breaks will hide the population you care about. Use log scaling or percentile breaks, and remember that a threshold separating background from anomaly in one regolith domain will not do so in another.
The caveat to record every time
A residual soil or rock sample describes the bedrock beneath it. A sample over transported cover describes the till, not what is under the till. Record the sample medium either way, because a reader who does not know which one they are looking at cannot judge the result.
Shapes you draw
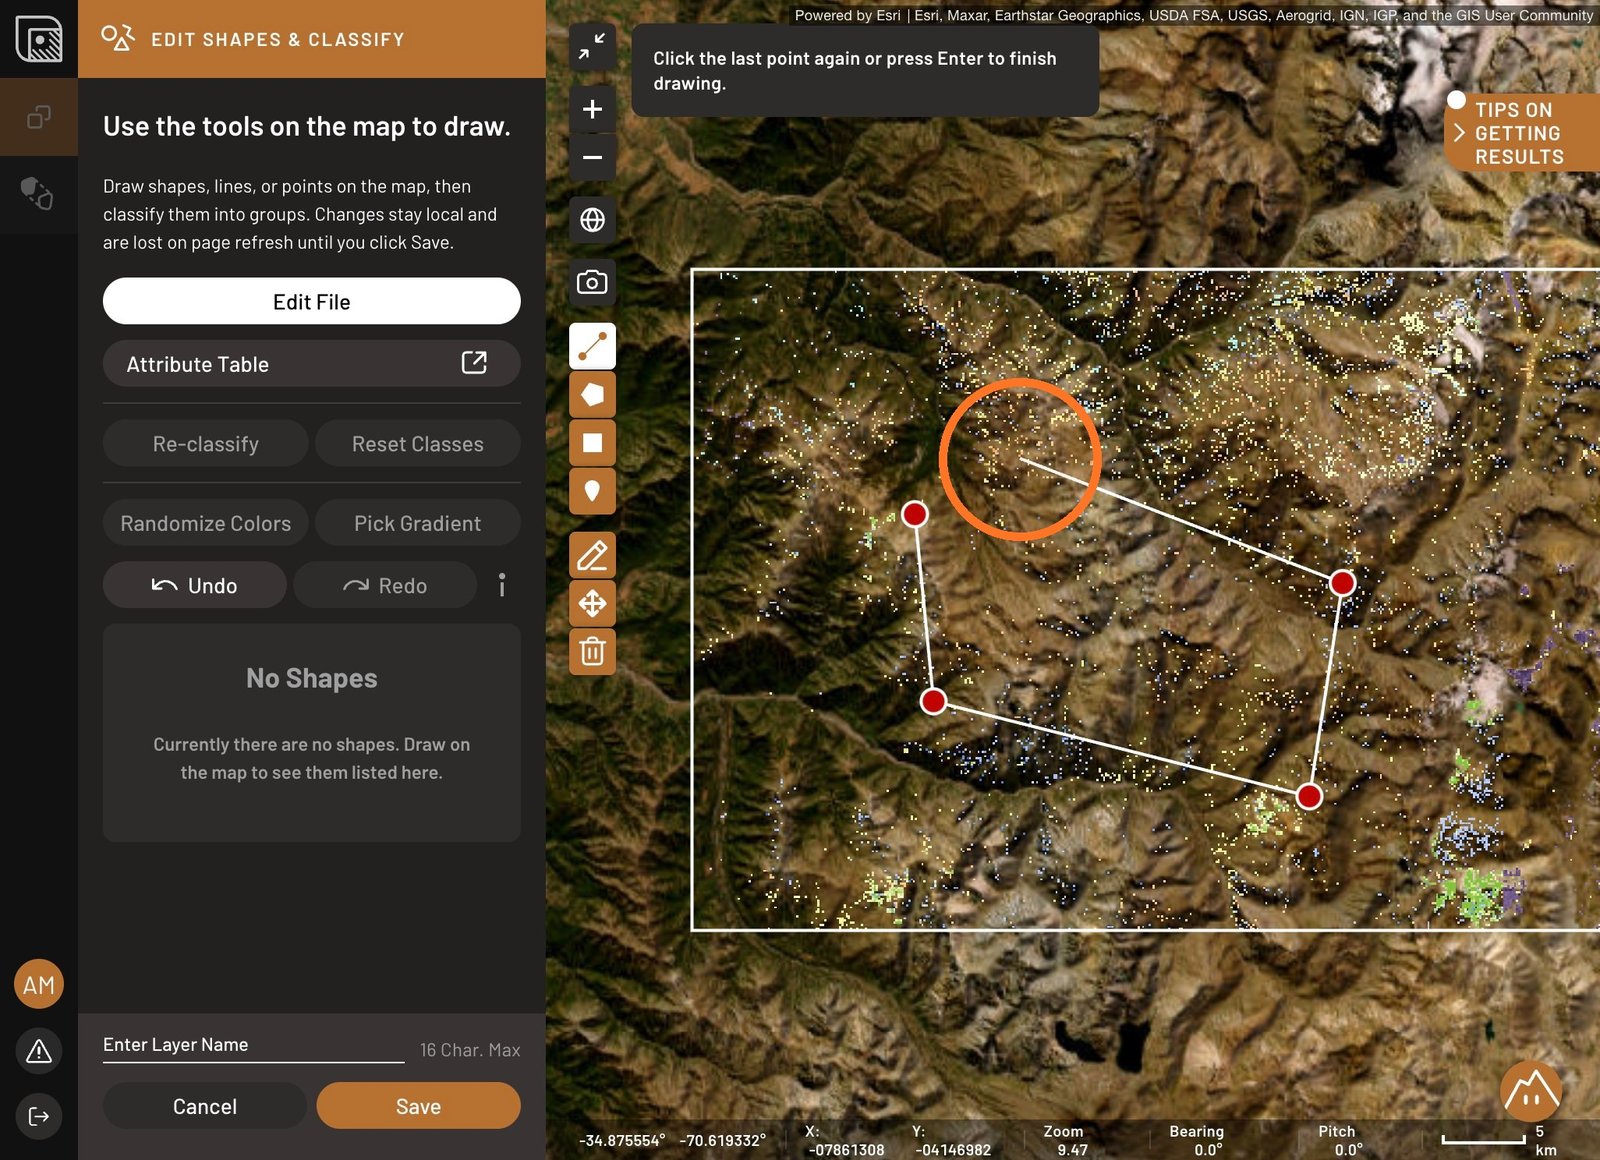
Shape layers are notes to yourself with coordinates attached. Two uses come up in nearly every pass:
- Marking man-made bare ground, such as tailings, dumps, quarry faces, haul roads and artisanal pits. Masks do not remove these, and crushed dry rock often produces the strongest matches in the whole scene. Outlining them early stops you chasing your own mine site.
- Saving pixel locations to come back to. A single bright pixel can be real, and once you tighten a threshold it disappears. Draw it before you lose it.
Each shape layer gets its own attribute table, starting with editable name and note columns, and can be styled with fills, opacity, and either random or graduated coloring by attribute.