App Sections
The left sidebar is the main navigation panel in TerraEye. It gives you quick access to all key sections of the application.
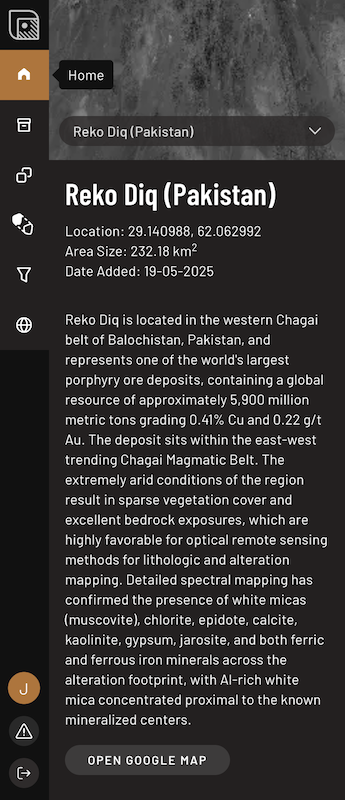
Home
The Home tab displays basic information about your area, including its name, centroid location, size, and creation date.
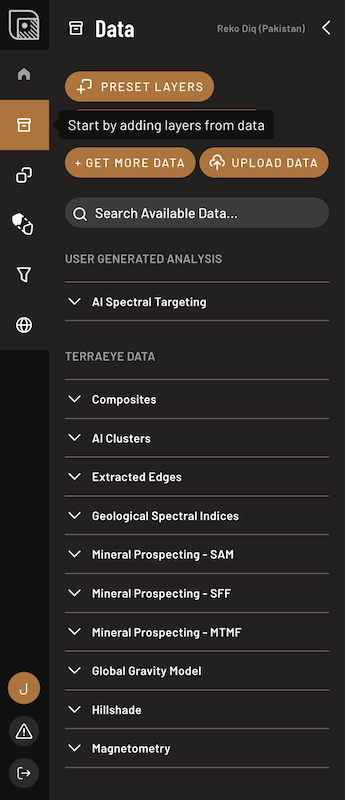
Data
The Data tab is your central place for managing all data in your project. Click + ADD — also available from the Layers tab — to:
- draw a custom shape,
- order AI Spectral Targets,
- add preset layers for a specific deposit type,
- request additional satellite data and analysis,
- upload your own data.
Layers you add here become available in the Layers tab for visualization.
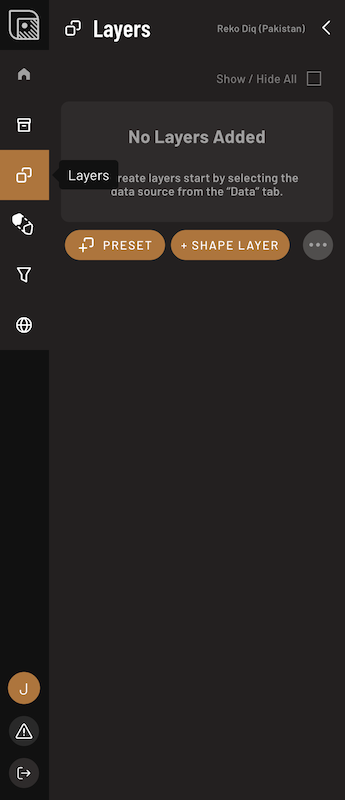
Layers
The Layers tab allows you to manage and visualize data layers on the map. Here you can:
- view all layers from Data tab,
- adjust layer properties such as color, opacity, and value range,
- toggle layers on or off to customize the map view,
- export layers for external use,
- click + ADD — the same menu as in the Data tab — to draw a shape, order AI Spectral Targets, add preset layers, request more data, or upload your own data.
Analogy Lab
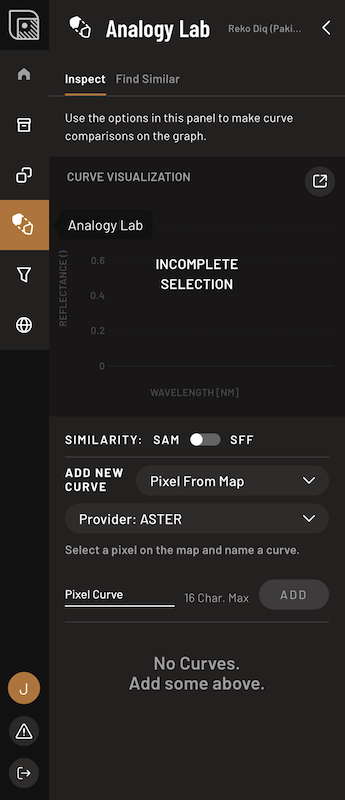
The Analogy Lab is an advanced tool for analyzing mineral and plant spectral curves. Here you can:
- visualize and analyze spectral curves for selected pixels,
- compare pixel curve with multiple mineral and plant lab spectral curves,
- identify pixels across your area that are spectrally similar to a selected pixel.
Data Masking
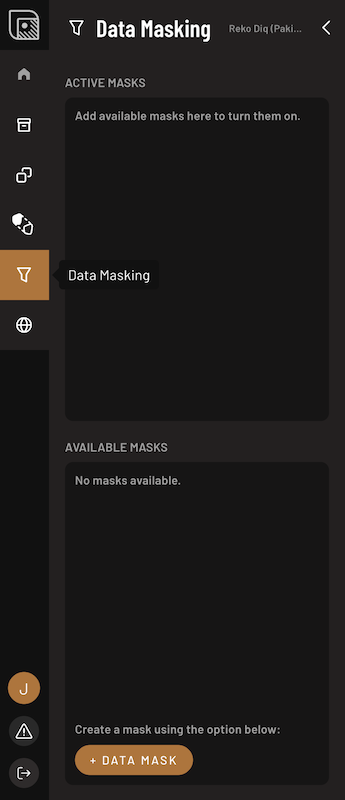
The Data Masking provides tools for defining and applying masks to refine your analysis results. Here you can:
- create custom masks for different satellite providers,
- apply predefined filters to exclude specific surface types such as vegetation, water, snow and clouds, or non-bare soil,
- combine multiple masks for more complex analyses.
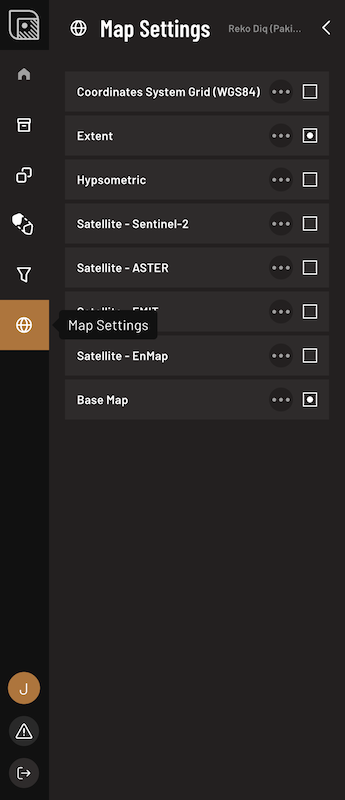
Map Settings
The Map Settings section allows you to customize the map view. Here you can:
- choose base map types,
- display raw satellite data,
- add elevation context with the hypsometric data,
- switch between 2D and 3D view to highlight topography,
- display a coordinates grid,
- display the boundaries of your area of interest.