Quick Start
This guide walks you from logging in to completing your first analysis in TerraEye.
Tips on getting results
Inside a workspace, look for the Tips on getting results panel on the right side of the screen — TerraEye's built-in Spectral Exploration Workflow: A Step-by-Step Guide. New to spectral analysis? You're in the right place. Work through the phases in order — each one tells you what to click, why it matters, and how you know you're done.
Before you begin
You need:
- An active account → see Create an account.
- Access to the platform → see Sign In.
After signing in, you will see a world map with all your areas displayed as points — this is the Dashboard. See Dashboard for a full breakdown.
Step 1 — Add new exploration area
Click New Exploration Area to order a new area for analysis. Provide a name for your area and select the quarter where the most bare soil is exposed and the least vegetation, snow, and clouds is present. Search for location using Google Search Bar or zoom in on the map. Define your project extent by drawing a rectangular polygon or uploading a GeoJSON file in WGS 84 (EPSG: 4326) coordinate system. Optionally, add additional satellite providers or a Bare Earth Composite to your order by checking the relevant box.
Step 2 — Select an area
Click on any point to open one of the available demo areas or one of your projects. You can also search for a specific area by typing its name in the Search area... field.
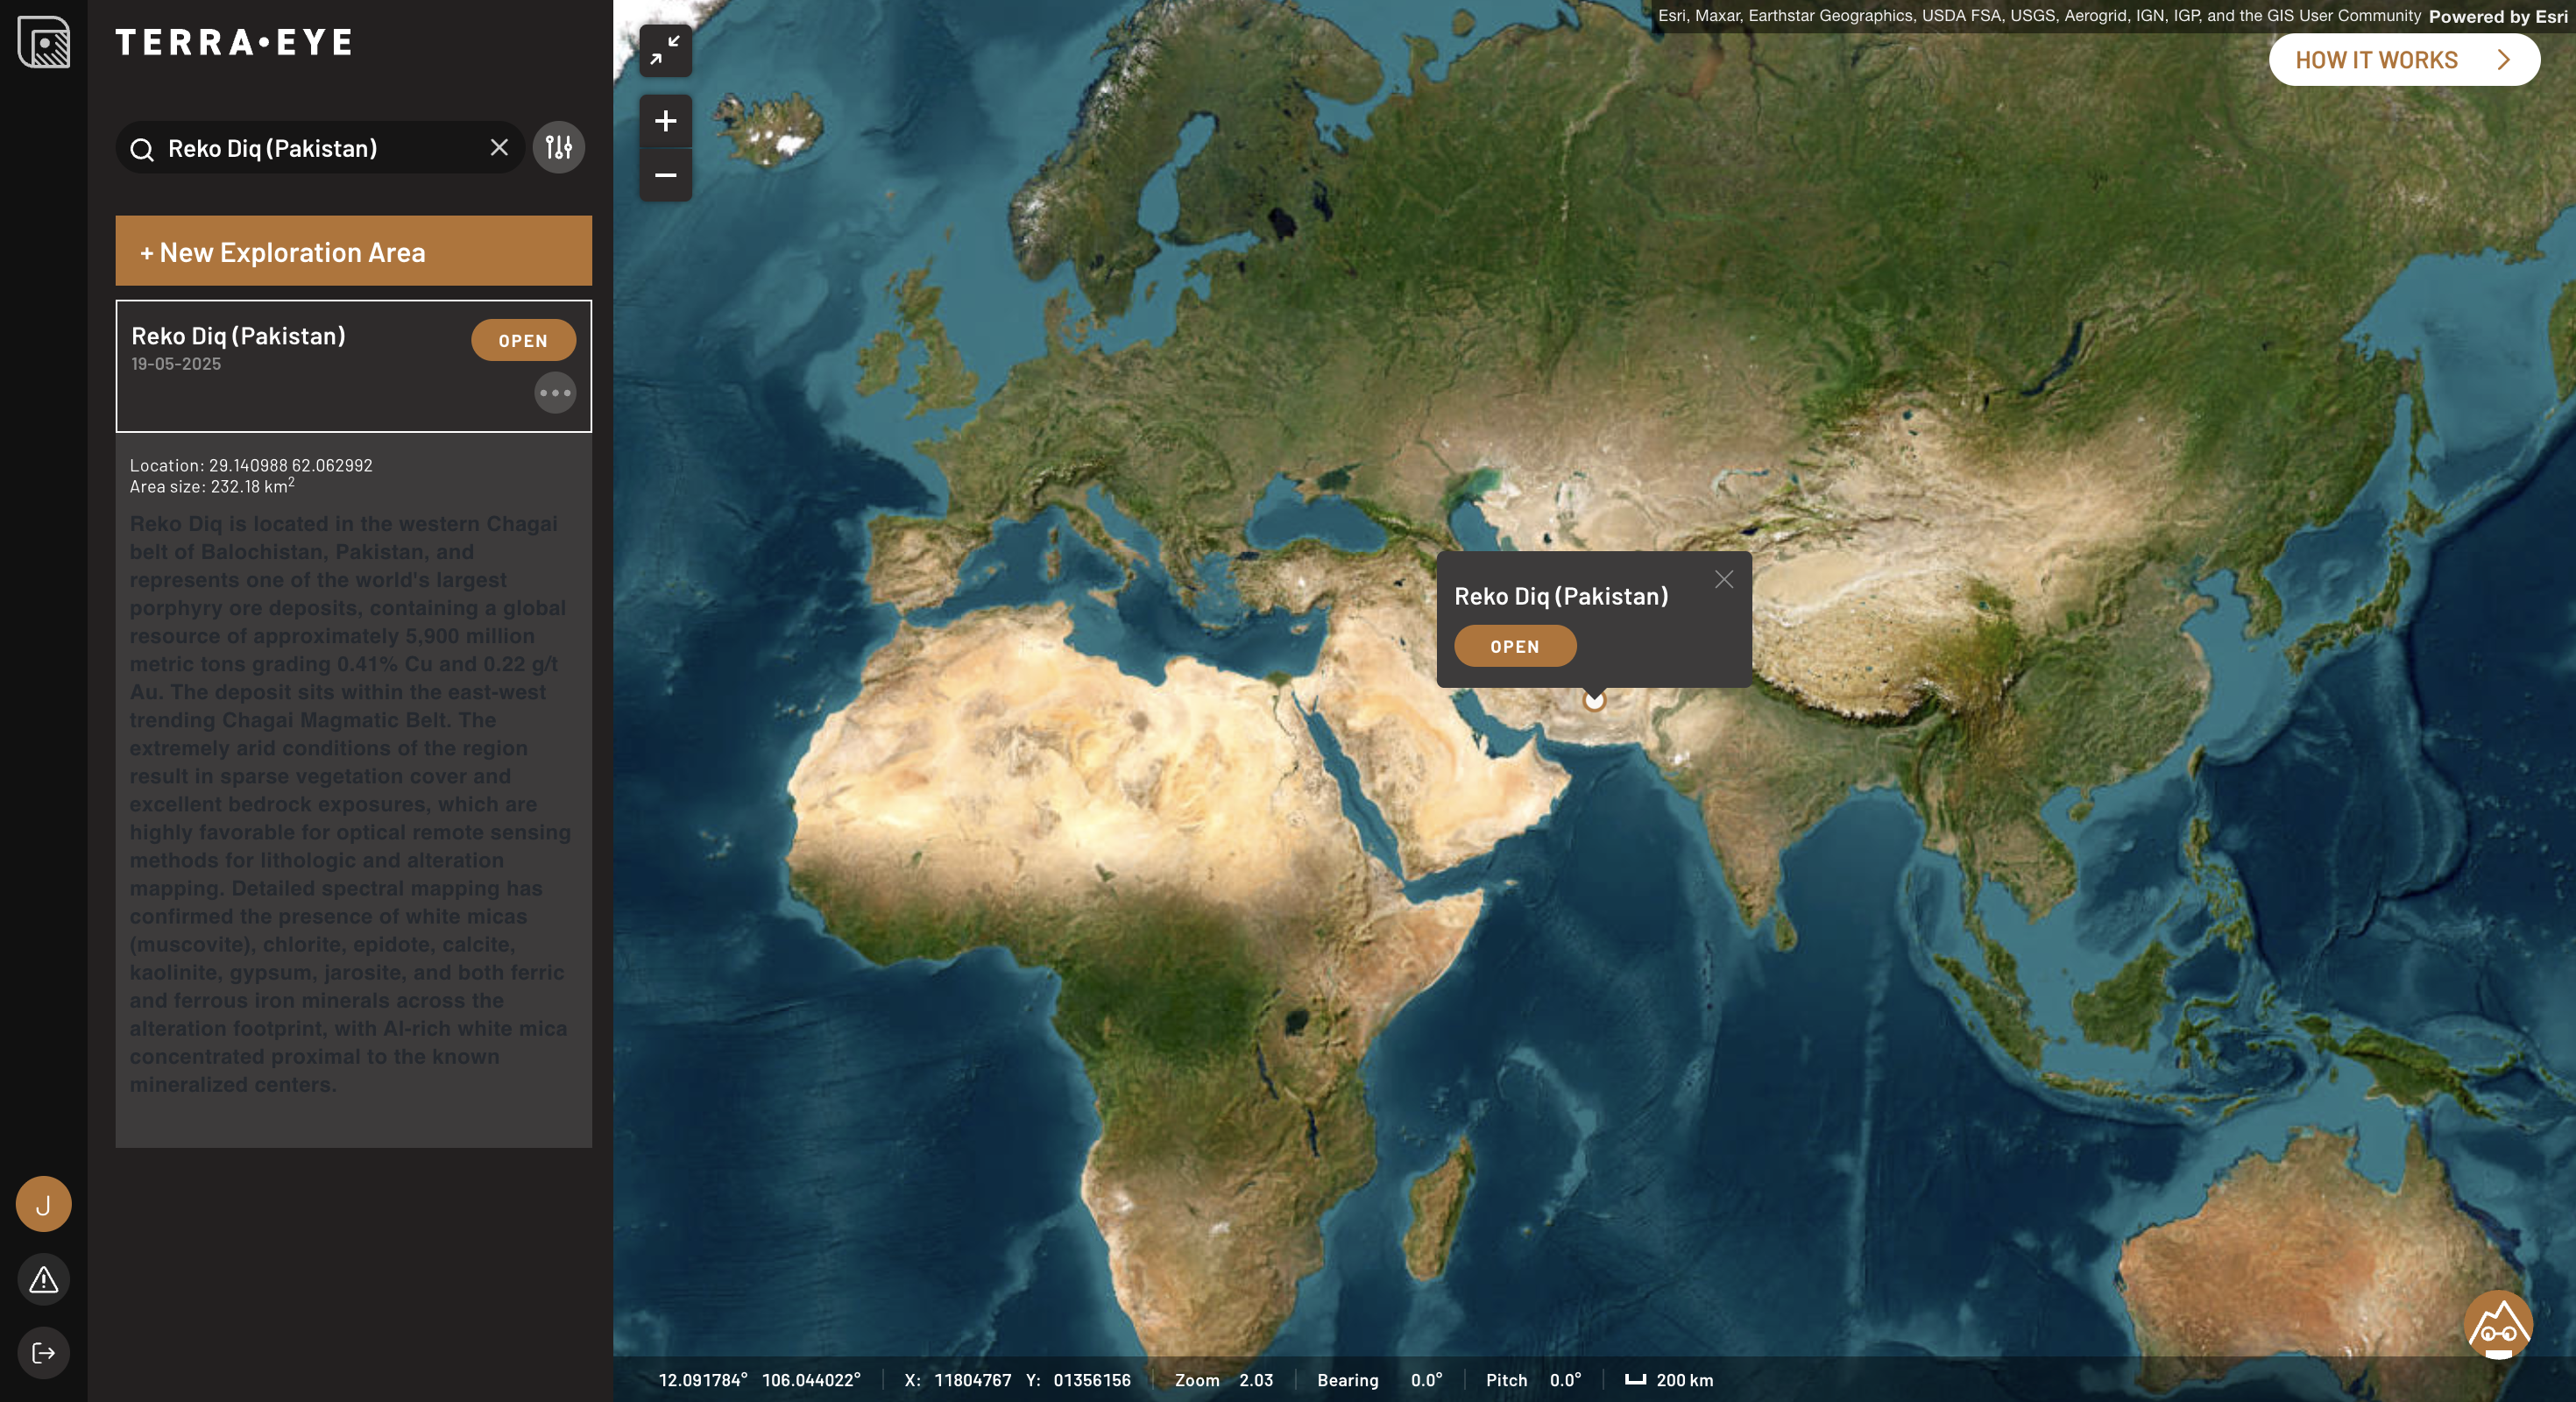
Opening an area switches the platform into its dedicated workspace.
Step 3 — Understand the workspace
Once inside an area, you are in the analysis environment. The workspace consists of:
- the map — for visual interpretation of results
- the left panel — for accessing data, tools and control. See App Sections for a full breakdown of the left panel.
All actions from now on apply only to the selected area.
Step 4 — Mask satellite data
To improve your analysis results, use the Data Masking to remove unwanted surface types — such as vegetation, water, snow, or clouds — from each satellite dataset before interpreting the results.
Step 5 — Load and display data
- Go to the Data tab in the left sidebar.
- Expand any available result and click Add layer.
- Switch to the Layers tab and toggle the layer on to make it visible on the map.
- Adjust the layer properties such as color, opacity, and value range to customize the visualization.
Step 6 — Inspect and interpret
To better understand the results:
- Use the Analogy Lab to inspect the spectral curves of individual pixels and compare them with mineral and plant reference spectra.
- Zoom in and compare areas on the map.
- Toggle layers on and off to contrast different results.
At this stage, you are already performing a real analysis workflow.
What you just did?
You have:
- created and selected an area
- entered its dedicated workspace
- masked unwanted surface types
- loaded a dataset and displayed it on the map
- inspected spectral characteristics
- optionally refined the result
Where to go next?
- Learn about TerraEye's data and methods → TerraEye Data & Methods
- Explore your area with AI-powered mineral detection → AI Spectral Targeting
- Refine and interpret your results → TerraEye Laboratories
- Have questions? Ask Ignacy, TerraEye's built-in AI assistant → Ignacy