Left Panel (AOI Workspace)
The left panel is the control center of the workspace.
It lets you inspect the selected area, access datasets, analyze pixels, refine results, and control map visualization.
Note
The layout of the panel may change between versions, but the purpose of each section remains consistent.
What you do here
Inside the panel you typically:
- Check area information
- Load datasets and results
- Display layers on the map
- Inspect spectral behavior
- Refine results using masking
- Adjust map visualization
Typical workflow
A common analysis session looks like this:
- Open an area
- Load a dataset (Data tab)
- Display it (Layers tab)
- Inspect pixels (Spectral Editor)
- Clean the result (Masking)
- Adjust context (Map settings)
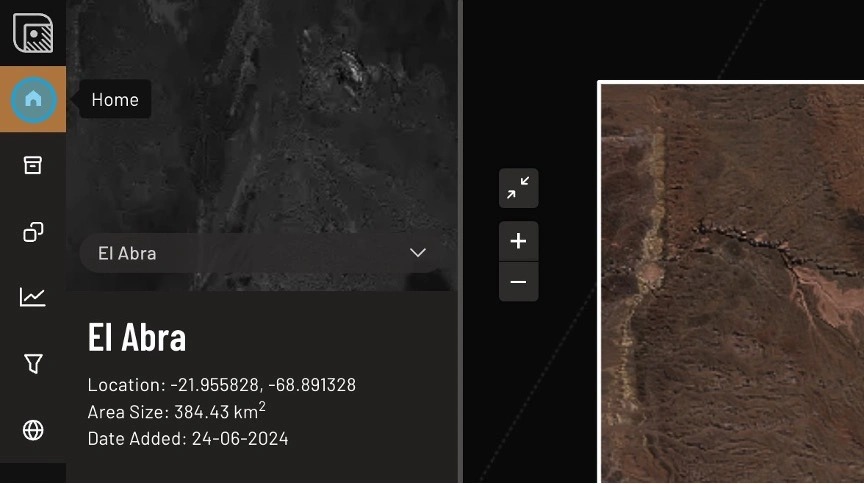
Area information
The Home section shows basic metadata about the current area such as name, size and creation date.
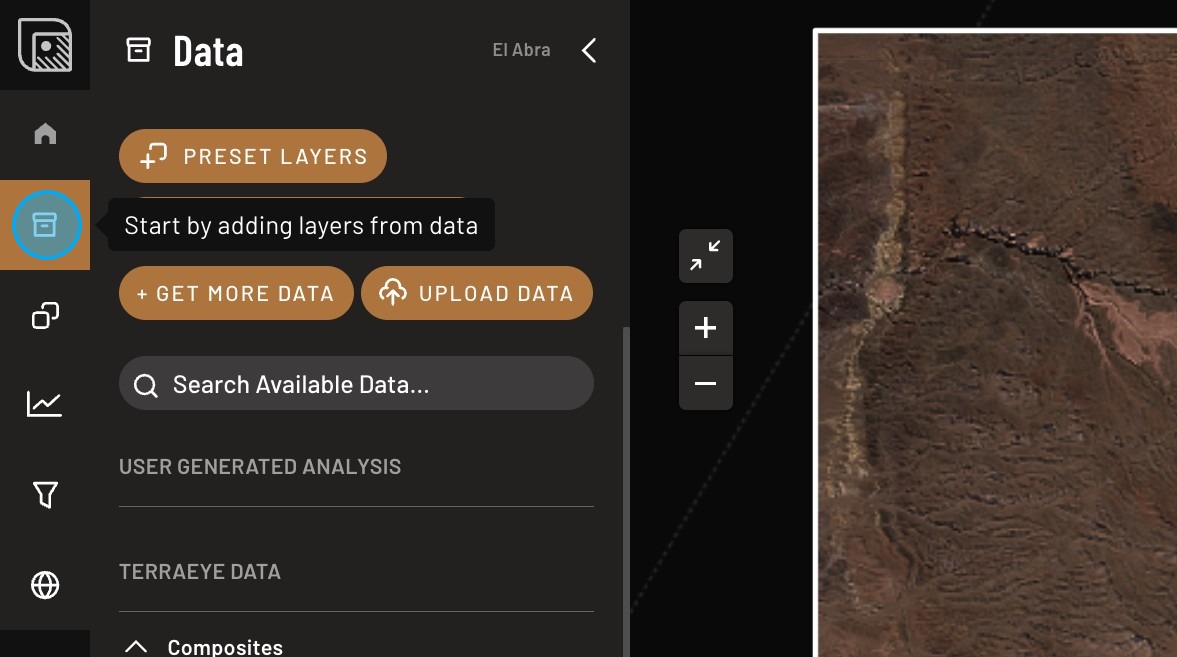
Load and manage data
Use the Data section to access available results and request new analyses.
Typical actions: - open generated outputs - upload vector data - run additional processing
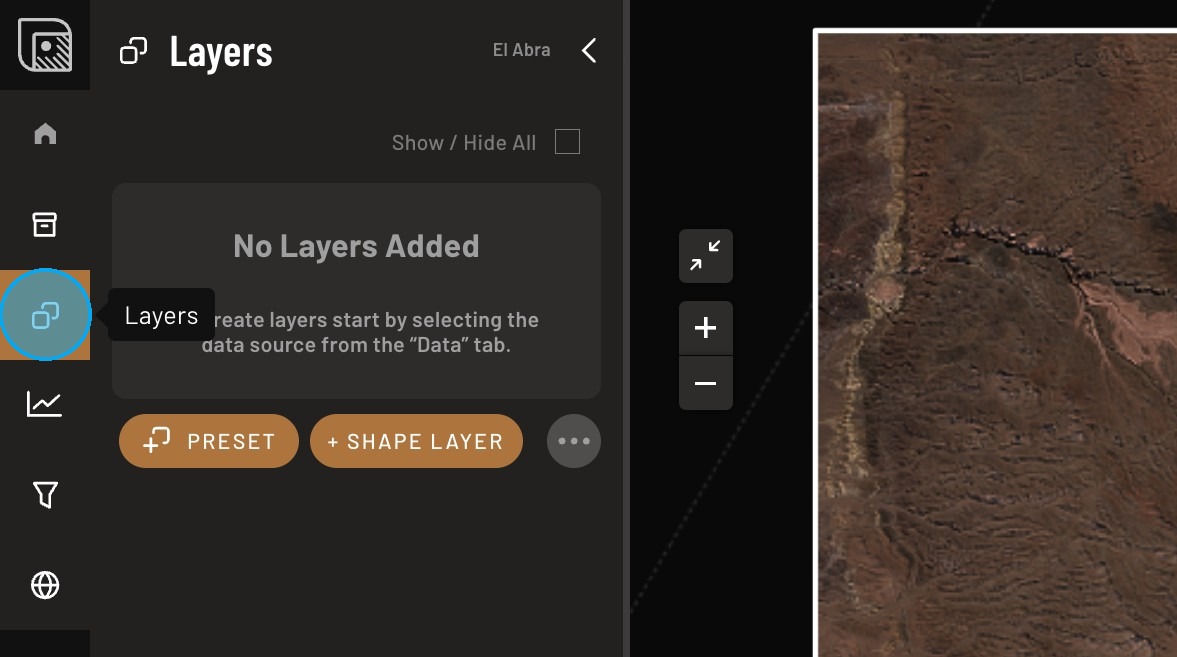
Visualize results
The Layers section controls what is visible on the map.
You can: - toggle visibility - group layers - change styling - draw annotations
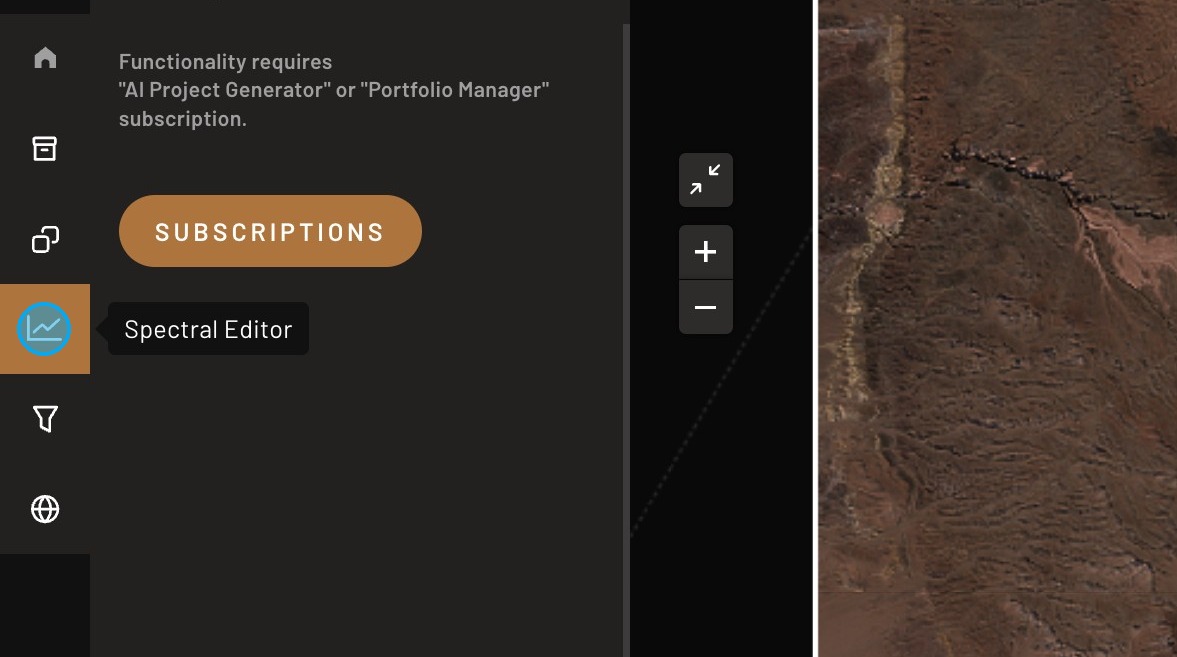
Analyze pixels
Spectral Editor lets you inspect spectral curves and compare them with reference materials.
Typical use: - check if anomaly behaves like mineral - compare pixels inside vs outside target zone
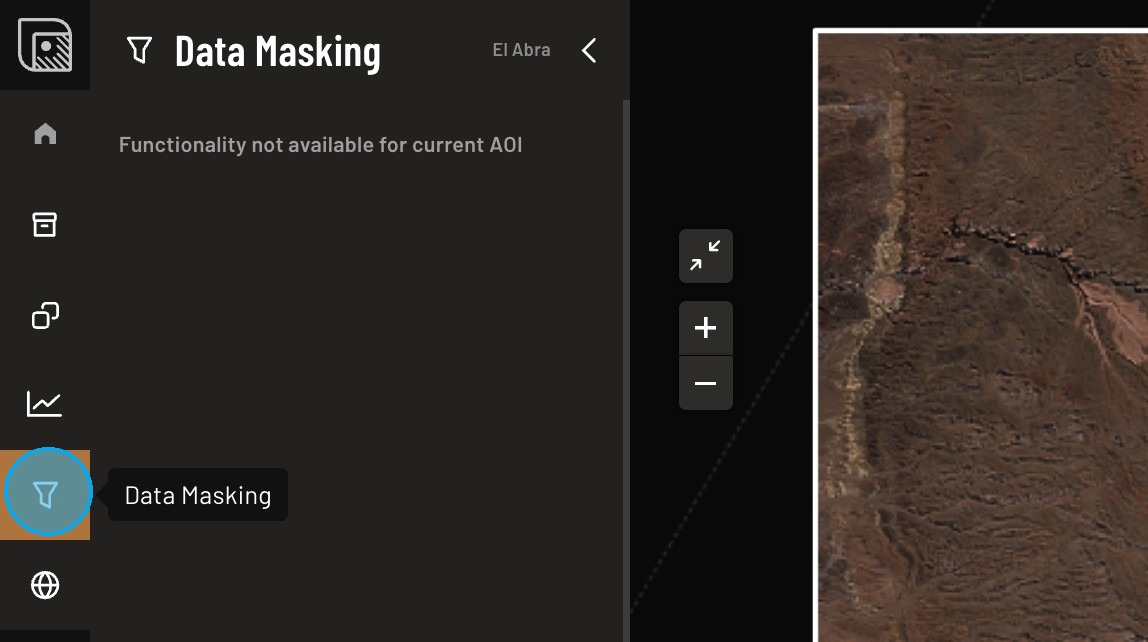
Refine results
Masking tools help remove false positives from analysis outputs.
Typical masks: - vegetation - water - snow/clouds
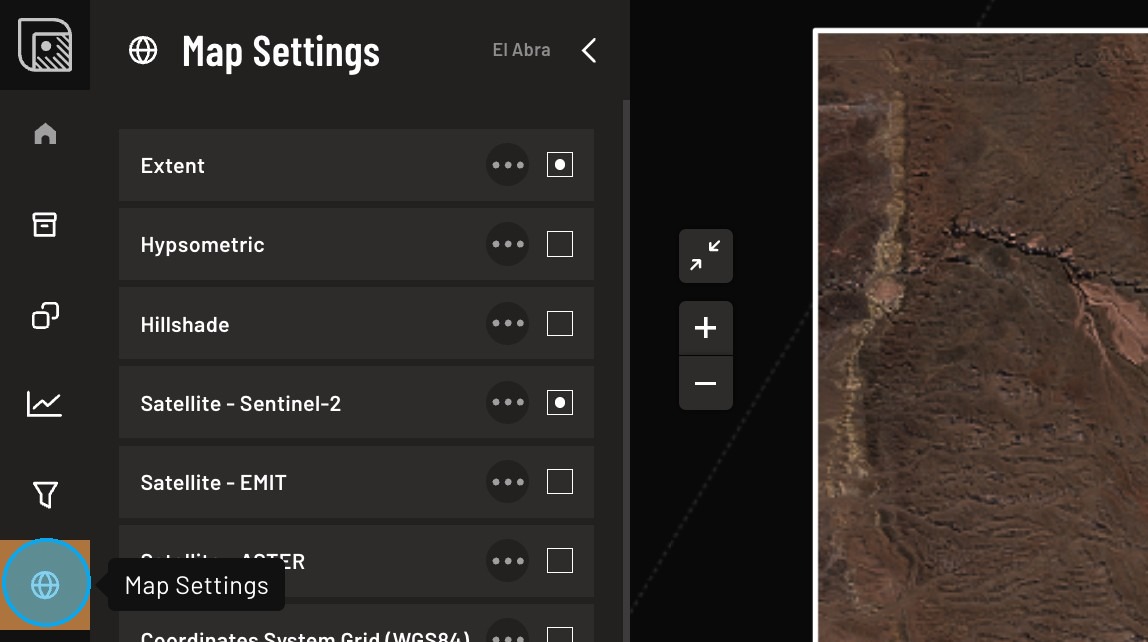
Adjust map context
Map settings control visual background and terrain context.
You can: - switch basemaps - enable raw imagery - enable hillshade/topography